GBP/USD 5-Minute Analysis
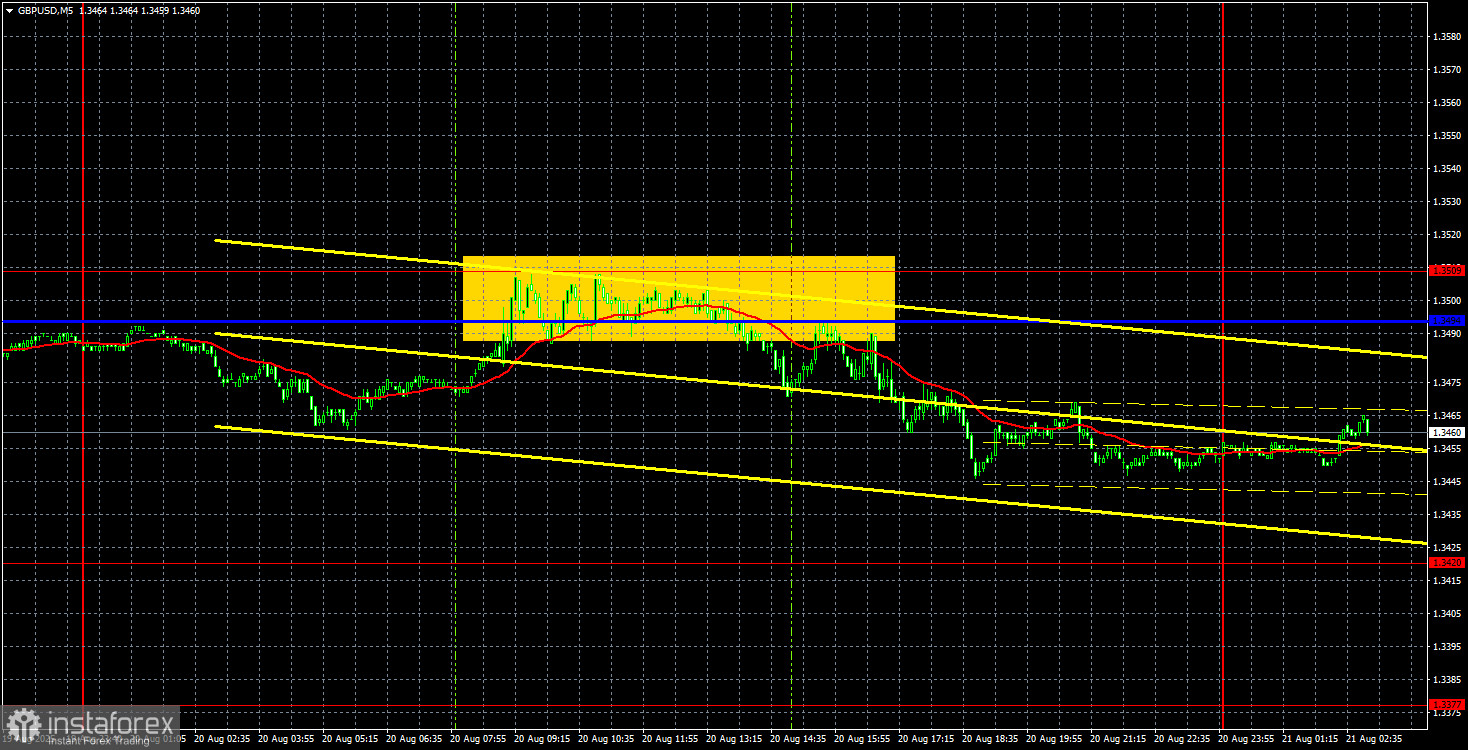
On Wednesday, the GBP/USD pair continued a weak downward move, which has a corrective character. The price consolidated below the ascending trendline, so the decline was expected. A decline, but not a reversal into a downward trend. Yesterday, traders could well have expected the British pound to rise, as the UK released July inflation data, which showed stronger-than-forecast acceleration. Specifically, forecasts predicted growth to 3.7–3.8% year-on-year, while the actual figure rose to 3.8%. In any case, inflation in the UK has been accelerating for 10 months, which significantly lowers the likelihood of a Bank of England key rate cut in 2025.
This is a bullish factor for the British currency, and indeed, the pound rose in the morning. However, the growth did not last long. In the second half of the day, the technical move south resumed. Below lies the Senkou Span B line, which serves as strong support for the price. We do not expect this line to be broken without strong fundamentals or macroeconomic drivers.
On Wednesday, only one trading signal was formed, and it developed over 6–7 hours. The price spent a long time testing the 1.3494–1.3509 area, but eventually bulls retreated. Thus, traders could have opened a short position on this signal, which even turned out to be profitable — by the end of the day, the pair had moved down about 20 pips.
COT Report
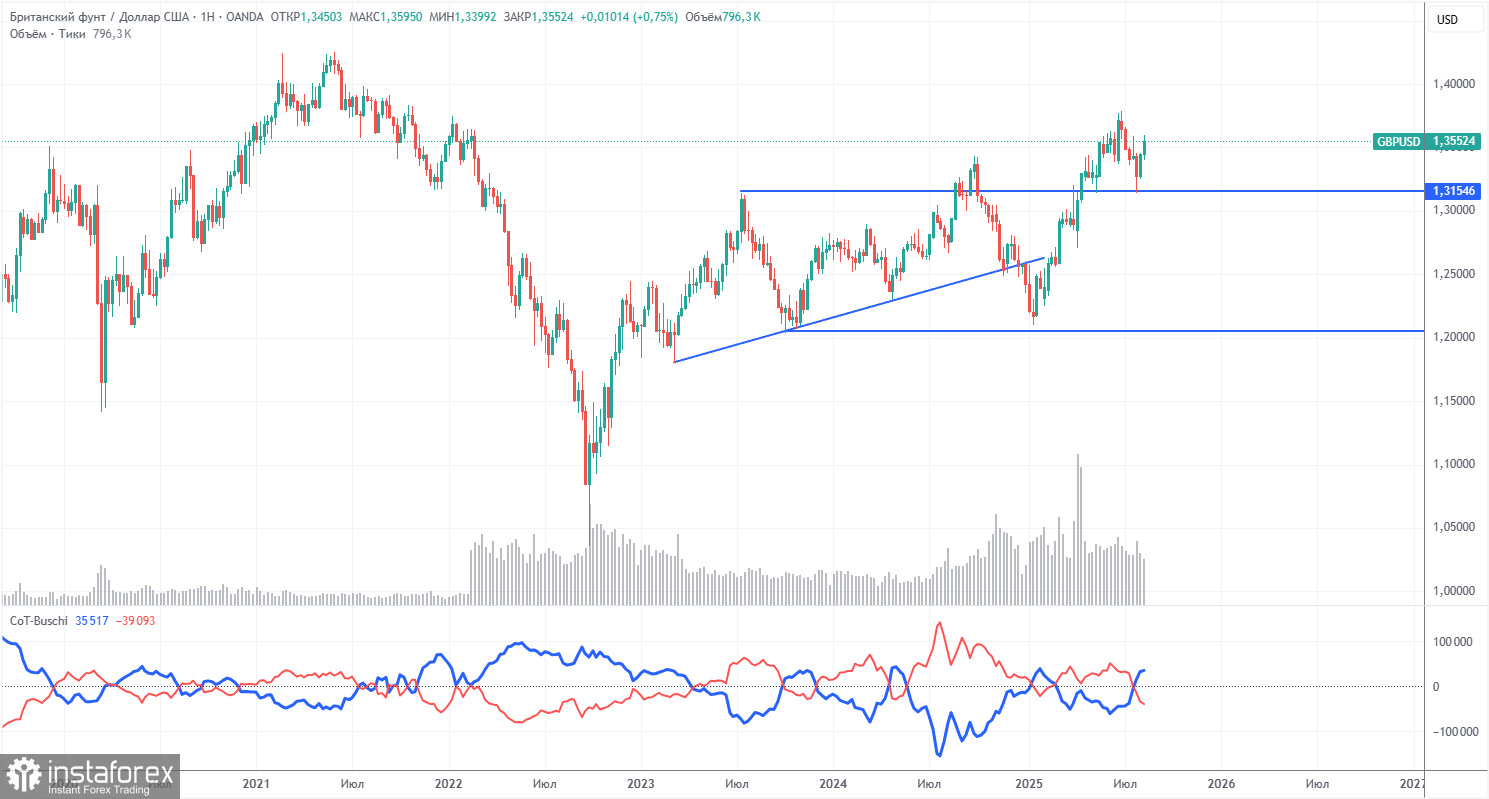
COT reports on the British pound show that in recent years, the sentiment of commercial traders has constantly shifted. The red and blue lines, which represent the net positions of commercial and non-commercial traders, frequently intersect and, in most cases, remain near the zero mark. At present, they have nearly converged again, indicating a roughly equal number of long and short positions.
The dollar continues to decline due to Trump's policies, so the demand of market makers for the pound is not particularly important right now. The trade war will continue in one form or another for a long time. Dollar demand will continue to decline. According to the latest report on the British pound, the "non-commercial" group opened 8,100 BUY contracts and 13,900 SELL contracts. Thus, the net position of non-commercial traders declined by another 5,800 contracts during the reporting week.
In 2025, the pound rose sharply, but it should be understood that there is only one reason: Trump's policy. Once this factor is neutralized, the dollar could move into growth, but no one knows when that will happen. It does not matter much how fast the net position for the pound grows or falls. The dollar is falling regardless, usually at a faster pace.
GBP/USD 1-Hour Analysis
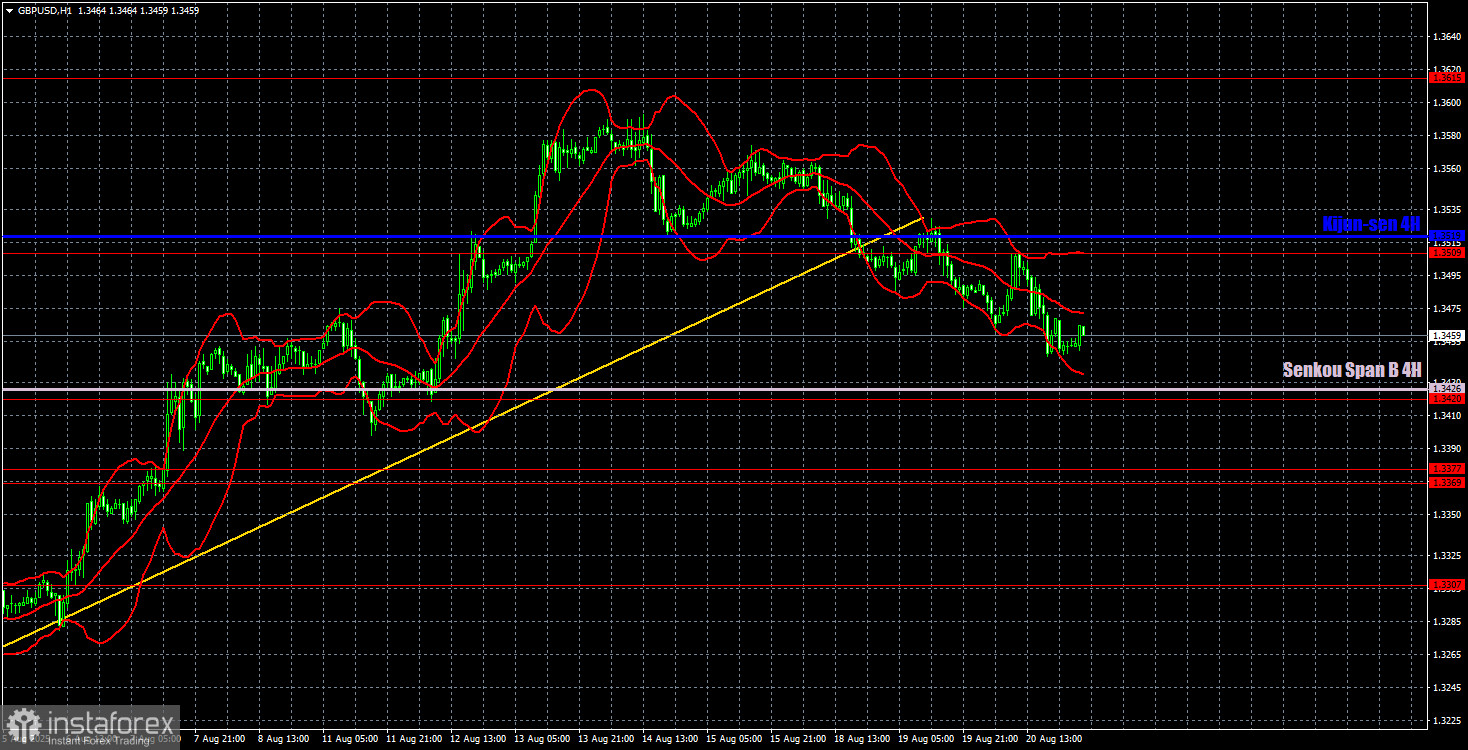
On the hourly timeframe, the GBP/USD pair continues correcting within the framework of an upward trend, while on the daily timeframe, it rebounded from the important and strong Senkou Span B line. From our perspective, the fundamental background still does not favor the U.S. currency, so in the long term, we expect the continuation of the "2025 trend." The dollar can still count on growth only within purely technical corrections.
For August 21, we highlight the following important levels: 1.3125, 1.3212, 1.3369–1.3377, 1.3420, 1.3509, 1.3615, 1.3681, 1.3763, 1.3833, 1.3886. The Senkou Span B line (1.3426) and the Kijun-sen line (1.3519) may also serve as sources of signals. Stop Loss is recommended to be set at breakeven once the price moves 20 pips in the right direction. The Ichimoku indicator lines may shift during the day, which should be considered when determining trading signals.
On Thursday, the UK and the U.S. will release August business activity indices for the services and manufacturing sectors. The UK indices will carry more weight, but yesterday we already saw that the market reacted very weakly to UK data. Most likely, traders' reaction today will also be muted.
Trading Recommendations
We believe that on Thursday, the market will continue showing sluggish moves with minimal volatility, very close to flat conditions. After breaking the trendline, we do not believe the trend has shifted to bearish. However, the downward correction may continue toward the Senkou Span B line, a rebound from which could trigger the resumption of the upward trend.
Illustration Explanations:
- Support and resistance price levels – thick red lines where movement may end. They are not trading signal sources.
- Kijun-sen and Senkou Span B lines—These are strong Ichimoku indicator lines transferred to the hourly timeframe from the 4-hour one.
- Extremum levels – thin red lines where the price has previously rebounded. These act as trading signal sources.
- Yellow lines – trend lines, trend channels, and other technical patterns.
- COT Indicator 1 on the charts – the size of the net position for each category of traders.