Analysis of Thursday's Trades:
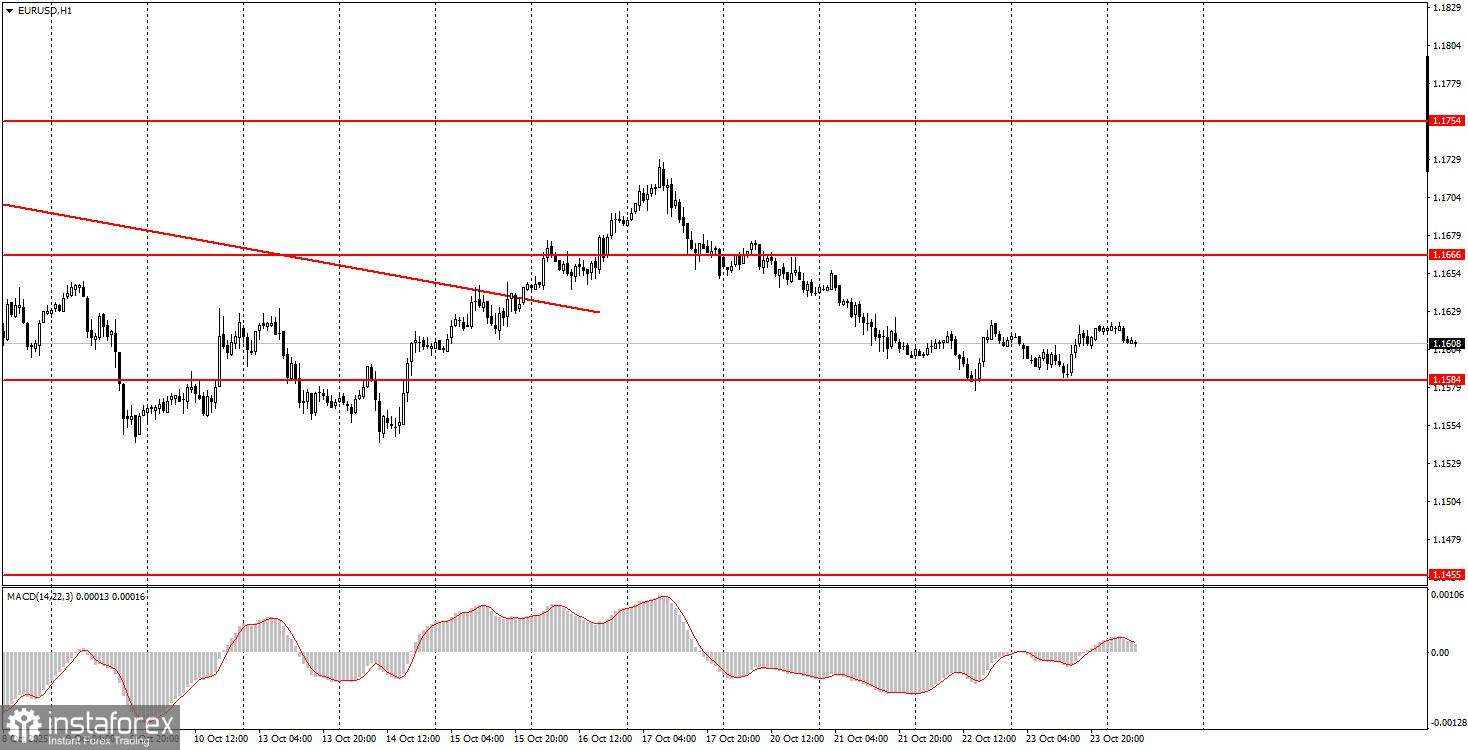
1H Chart of the EUR/USD Pair
On Thursday, the EUR/USD currency pair showed no notable movements. There were practically no movements, and volatility continues to reach record lows day after day. While at the beginning of the week we observed a very weak but still downward movement, on Wednesday and Thursday the trend was sideways. This indicates that the market has essentially "died." Today, however, it might come back to life, as this is the first day of the week with at least some macroeconomic data releases. Therefore, volatility is expected to increase.
Unfortunately, a flat trend persists on the daily time frame, which remains the main reason for the illogical movements in recent weeks. So even with the release of a relatively large number of macroeconomic reports today, it is unlikely that price movements will become more logical. Technically, the picture is quite poor as well. The descending trendline was broken and... nothing happened after that. An uptrend has yet to begin.
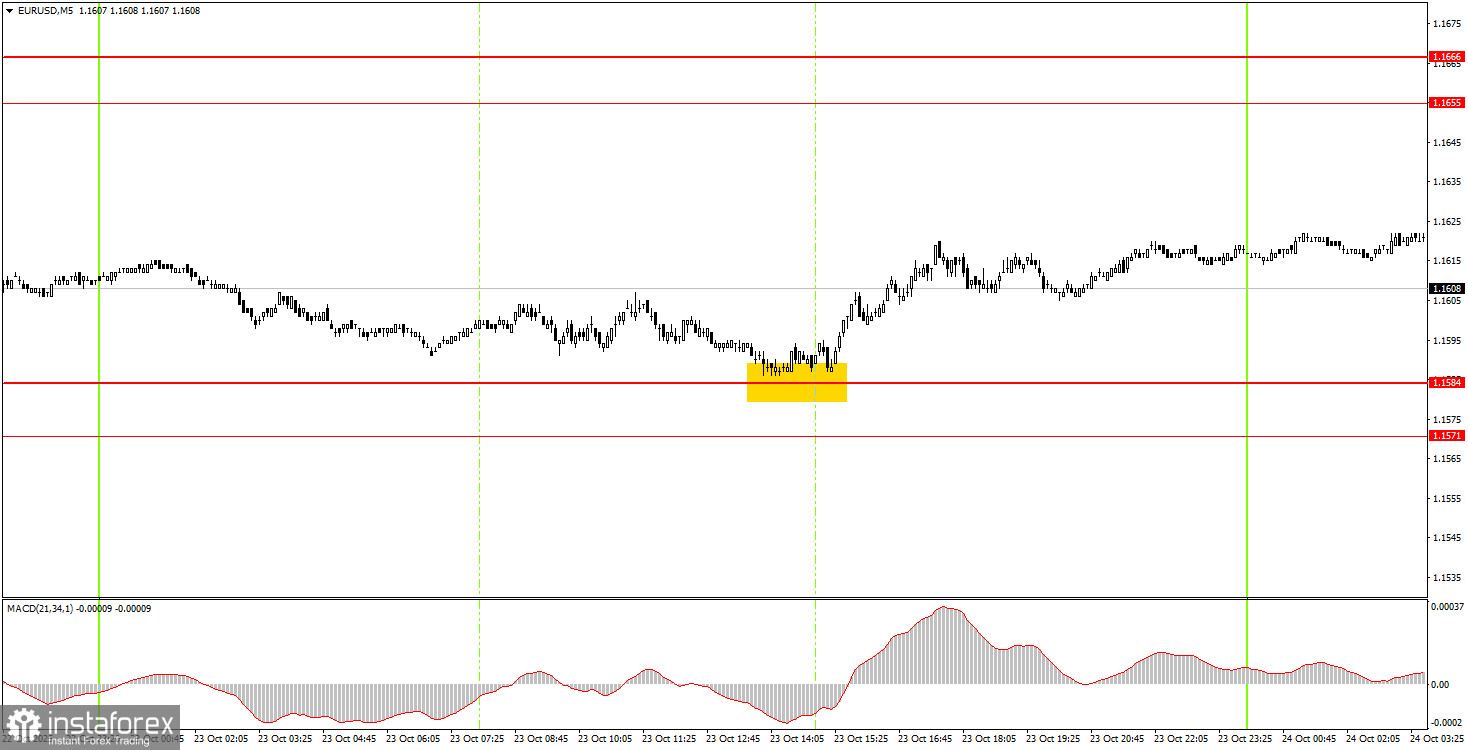
5M Chart of the EUR/USD Pair
On the 5-minute time frame, one trading signal was formed on Thursday, and it was decent. At the very start of the U.S. trading session, the price bounced from the 1.1584 level and rose by 20 pips by day's end, which, given current volatility, is still a relatively good move.
How to Trade on Friday:
On the hourly time frame, the EUR/USD pair shows some signs of a beginning uptrend. The descending trendline was broken once again, while the overall fundamental and macroeconomic backdrop remains weak for the U.S. dollar. Therefore, we continue to expect the resumption of the 2025 uptrend. However, the daily time frame still reflects a flat market, as evidenced by low volatility and illogical price action on lower time frames.
On Friday, the EUR/USD pair may move in any direction, as there will be a significant number of macroeconomic reports. New trading signals should be expected in the 1.1571–1.1584 area. Yesterday, the pair already formed a buy signal in this zone. Today, everything will depend on the nature of the macroeconomic data released.
On the 5-minute time frame, levels to watch are: 1.1354-1.1363, 1.1413, 1.1455-1.1474, 1.1527, 1.1571-1.1584, 1.1655-1.1666, 1.1745-1.1754, 1.1808, 1.1851, 1.1908, 1.1970-1.1988.
For Friday, the U.S. and the Eurozone have scheduled the release of business activity indices for October in the services and manufacturing sectors. Additionally, the U.S. will publish its inflation report, which is considered the "main report of the week." Thus, we should expect at least some market movement today.
Basic Rules of the Trading System:
- The strength of a signal is determined by how quickly it forms (i.e., a bounce or breakout of a level). The shorter the time, the stronger the signal.
- If two or more false signals appear near a certain level, all subsequent signals from that level should be ignored.
- In a flat market, any currency pair may generate many false signals or none at all. In any case, it's better to stop trading at the first signs of a flat trend.
- Trade entries should occur between the start of the European session and the middle of the U.S. session. All trades should be closed manually afterward.
- On the 1-hour chart, MACD signals should be acted on only when there is significant volatility and a trend confirmed by a trendline or trend channel.
- If two levels are located too closely together (5–20 pips apart), consider them as a support or resistance zone.
- Once the price moves 15 pips in the correct direction, a Stop Loss should be moved to breakeven.
What's on the Charts:
Support and resistance price levels – levels that serve as targets when opening buy or sell trades. Take Profit levels can be placed near them.
Red lines – channels or trendlines that show the current trend and indicate the preferred trading direction.
MACD (14,22,3) indicator – histogram and signal line – a supporting indicator that can also be used as a signal source.
Important speeches and reports (always listed in the economic calendar) can significantly affect the movement of currency pairs. Therefore, during their release times, trading should be highly cautious, or it's better to exit the market to avoid sharp reversals against the preceding movement.
Beginner traders on the Forex market should remember that not every trade will be profitable. Developing a clear strategy and sound money management are the keys to long-term success in trading.