empty
 
 
22.08.2025 06:45 AM
How to Trade the GBP/USD Pair on August 22? Simple Tips and Trade Analysis for Beginners

Analysis of Thursday's Trades

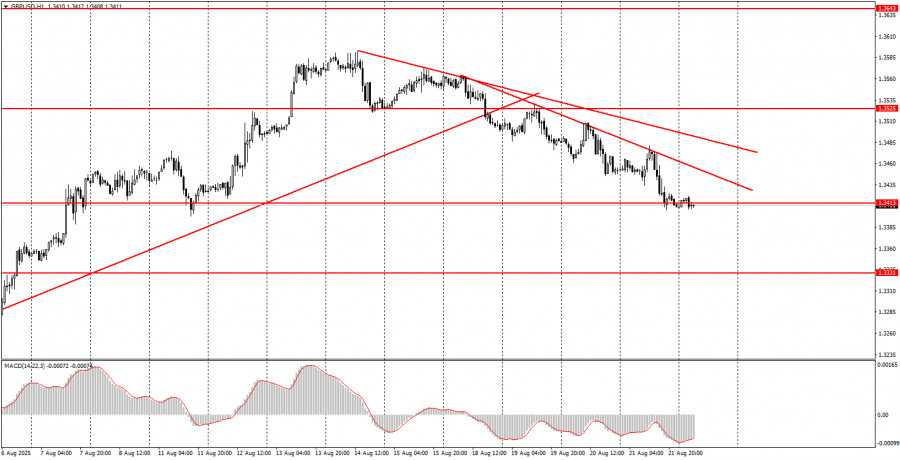
1H Chart of GBP/USD

This image is no longer relevant

On Thursday, the GBP/USD pair continued a mild downward movement, supported by two descending trendlines. The downward correction in the pound looks clearer, which makes the British currency more preferable for trading. Yesterday, business activity indices for August were published in the UK for the services and manufacturing sectors. However, a day earlier, a much more significant inflation report was released, which surprisingly failed to trigger a logical market reaction. The British pound rose briefly but then continued its technical corrective move. As for the UK business activity indices, they contradicted each other in the same way as the European ones. Only the US data triggered a natural market move, since all three reports aligned in character. Thus, the correction continues, but the main upward trend remains in place. Therefore, we expect the correction to end and growth to resume.

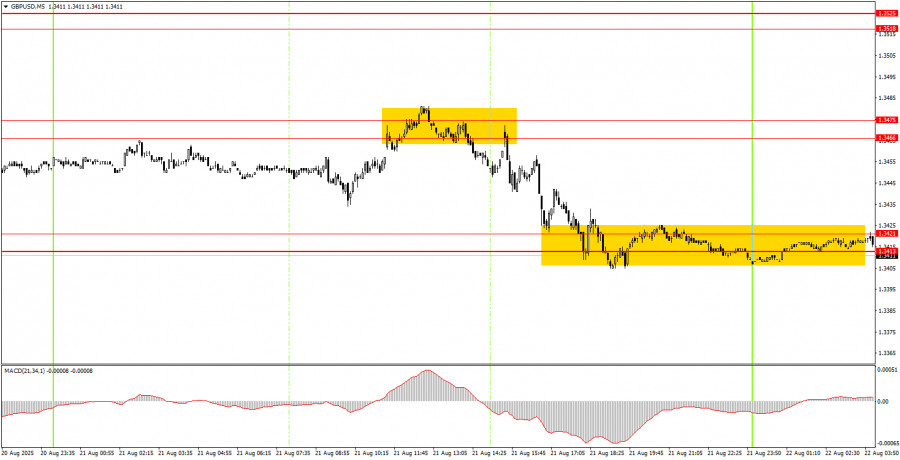
5M Chart of GBP/USD

This image is no longer relevant

On the 5-minute timeframe, two trading signals were formed on Thursday. The second one was not a signal but simply a test of the 1.3413–1.3421 area. There was neither a rebound nor a breakout from this area. Therefore, beginners could only trade the rebound from the 1.3466–1.3475 area. This rebound was not the most precise, but still allowed opening short positions. The profit on shorts could reach about 40 pips, and the pair's decline was seen only thanks to US reports.

Trading Strategy for Friday:

On the hourly timeframe, GBP/USD shows that the short-term downward trend remains. We believe this is only another correction, as the fundamental and macroeconomic background has not become more favorable for the dollar recently. Since there are very few macroeconomic and fundamental events this week, trading can be based on the technical picture. However, we still do not expect a strong decline in the pair.

On Friday, the GBP/USD pair may well resume its upward movement, as the correction could end at any moment. Trading (if there is such a desire under the current volatility) can be done today from the 1.3413–1.3421 area.

On the 5-minute timeframe, the following levels can currently be used for trading: 1.3102–1.3107, 1.3203–1.3211, 1.3259, 1.3329–1.3331, 1.3413–1.3421, 1.3466–1.3475, 1.3518–1.3532, 1.3574–1.3590, 1.3643–1.3652, 1.3682, 1.3763. On Friday, no events or reports are scheduled in the UK, while in the US, Federal Reserve Chair Powell's speech will take place in the evening. Powell's speech is not only the key event of the day but of the entire week. It may well turn the market around 180 degrees.

Core Trading System Rules:

  1. Signal Strength: The shorter the time it takes for a signal to form (a rebound or breakout), the stronger the signal.
  2. False Signals: If two or more trades near a level result in false signals, subsequent signals from that level should be ignored.
  3. Flat Markets: In flat conditions, pairs may generate many false signals or none at all. It's better to stop trading at the first signs of a flat market.
  4. Trading Hours: Open trades between the start of the European session and the middle of the US session, then manually close all trades.
  5. MACD Signals: On the hourly timeframe, trade MACD signals only during periods of good volatility and a clear trend confirmed by trendlines or trend channels.
  6. Close Levels: If two levels are too close (5–20 pips apart), treat them as a support or resistance zone.
  7. Stop Loss: Set a Stop Loss to breakeven after the price moves 20 pips in the desired direction.

Key Chart Elements:

Support and Resistance Levels: These are target levels for opening or closing positions and can also serve as points for placing Take Profit orders.

Red Lines: Channels or trendlines indicating the current trend and the preferred direction for trading.

MACD Indicator (14,22,3): A histogram and signal line used as a supplementary source of trading signals.

Important Events and Reports: Found in the economic calendar, these can heavily influence price movements. Exercise caution or exit the market during their release to avoid sharp reversals.

Paolo Greco,
InstaForex के विश्लेषणात्मक विशेषज्ञ
© 2007-2025
Summary
Urgency
Analytic
Stanislav Polyanskiy
Start trade
Earn on cryptocurrency rate changes with InstaForex
Download MetaTrader 4 and open your first trade
  • Grand Choice
    Contest by
    InstaForex
    InstaForex always strives to help you
    fulfill your biggest dreams.
    कॉन्टेस्ट में हिस्सा लें
  • चैन्सी डिपॉजिट
    $ 3,000 के साथ अपना खाता जमा करें और प्राप्त करें $1000 अधिक!
    में अगस्त हम आकर्षित करते हैं $1000 चैंसी डिपॉज़िट में
    ट्रेडिंग अकाउंट में $ 3,000 जमा करके जीतने का अवसर प्राप्त करें इस शर्त को पूरा करके आप प्रतियोगिता में भाग ले सकते हैं
    कॉन्टेस्ट में हिस्सा लें
  • ट्रेड वाइज़, विन डिवाइस
    कम से कम $500 के साथ अपने खाते में टॉप अप करें, कॉन्टेस्ट के लिए साइन अप करें और मोबाइल डिवाइस जीतने का मौका पाएं।
    कॉन्टेस्ट में हिस्सा लें
  • 100% बोनस
    अपनी जमा राशि पर 100% बोनस प्राप्त करने का आपका अनूठा अवसर
    बोनस पायें
  • 55% बोनस
    अपनी प्रत्येक डिपॉजिट पर 55% बोनस के लिए आवेदन करें
    बोनस पायें
  • 30% बोनस
    हर बार खाता टॉप अप करने पर 30% बोनस प्राप्त करें
    बोनस पायें

अनुशंसित लेख

अभी बात नहीं कर सकते?
अपना प्रश्न पूछें बातचीत.
Widget callback