EUR/USD
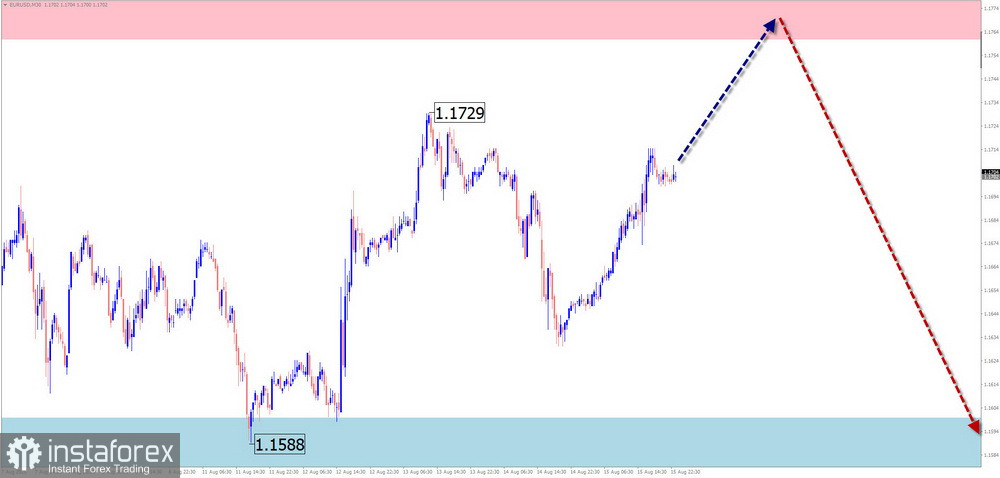
Analysis: On the chart of the major European currency pair, a complex corrective structure has been forming for the past two months. At the time of analysis, the shape of its extremes most closely resembles a shifting flat. The unfinished segment of movement from July 30 is directed upward. At the resistance level lies the lower boundary of a potential large-scale reversal zone. Breaking through this level immediately will be difficult.
Forecast: Over the coming week, the euro is expected to move within the corridor between the nearest opposing zones. In the first days, growth of the pair and pressure on resistance can be expected, with a possible brief breakout above the upper boundary. A reversal and the start of a decline may follow.
Potential Reversal Zones
Resistance:
Support:
Recommendations:
- Sales: May be used after confirmed signals appear near resistance. Keep in mind the limited potential of the upcoming decline.
- Purchases: Risky, with low potential.
USD/JPY
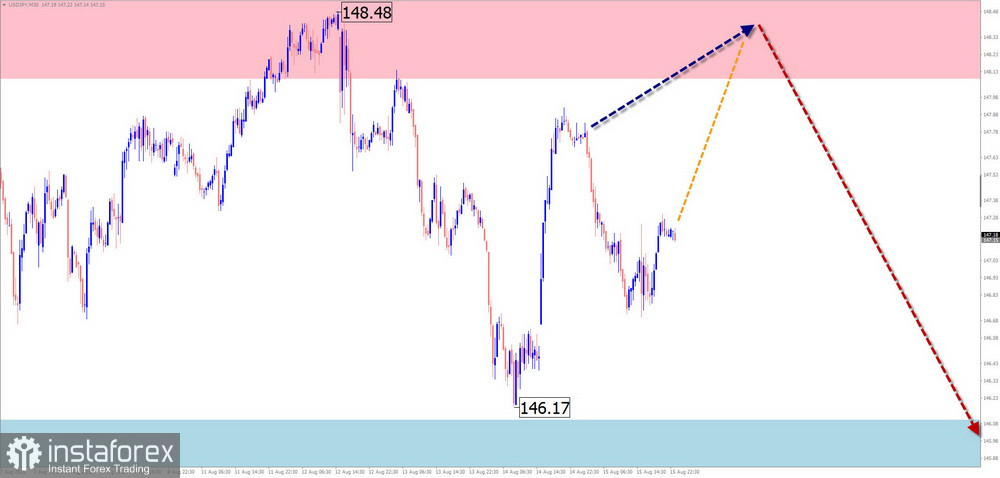
Analysis: On the Japanese yen chart, the short-term downward wave that began on August 1 continues. Two weeks ago, the pair broke through the resistance zone of the daily timeframe. In the following days, price consolidated above it, forming an intermediate correction. This movement is nearing completion. No signs of an imminent reversal are visible.
Forecast: At the start of the coming week, a sideways trend along the resistance zone is likely. Resumption of the decline is expected in the second half of the week. If direction changes, a sharp increase in volatility cannot be ruled out.
Potential Reversal Zones
Resistance:
Support:
Recommendations:
- Purchases: No conditions for such trades in the yen market.
- Sales: May be used after confirmed signals appear near resistance.
GBP/JPY
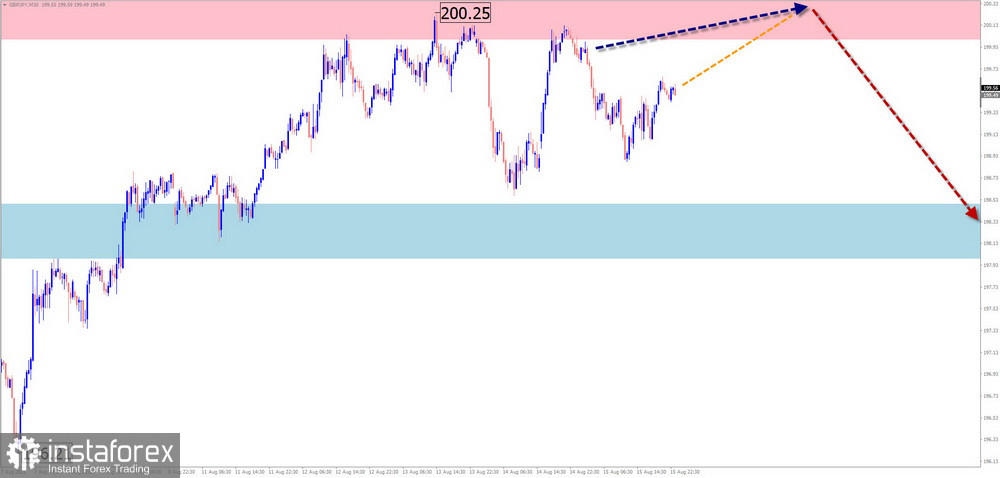
Analysis:On the GBP/JPY chart, the upward wave that began on August 4 continues to develop in the short term. Its unfinished corrective section has been in place since mid-August. At the time of analysis, price shows no signs of completion. The pair has pulled back toward the support zone.
Forecast:Over the upcoming week, a gradual rise toward the resistance zone is expected. At the beginning of the week, temporary pressure on the calculated support with a brief breakout of its lower boundary is possible.
Potential Reversal Zones Resistance:
Support:
Recommendations:
- Purchases: May be used intraday after confirmed signals appear near support.
- Sales: Risky, with low potential.
USD/CAD
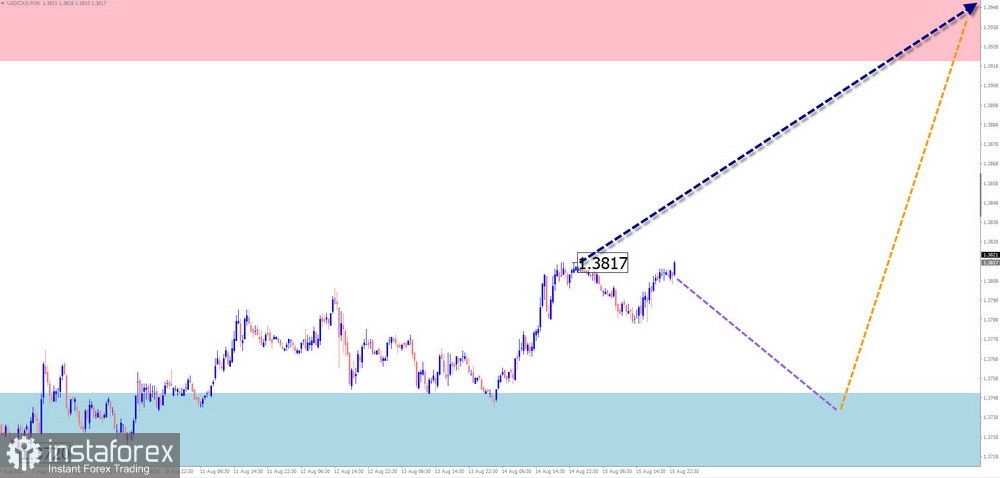
Analysis:After a period of U.S. dollar weakness against the Canadian dollar, the pair has been in correction since June. The chart's extremes form a shifting flat. The structure shows the development of the final segment (C). Late last week, the pair bounced downward from the lower boundary of the preliminary target zone.
Forecast:During the upcoming week, the downward vector is expected to continue until completion in the support zone. After that, a sideways drift and conditions for reversal may form. The chance for a change in direction could emerge by the end of the week.
Potential Reversal Zones
Resistance:
Support:
Recommendations:
- Purchases: Will become relevant after signals appear near support.
- Sales: May be used with reduced volume size during individual sessions. Potential is limited by support.
NZD/USD
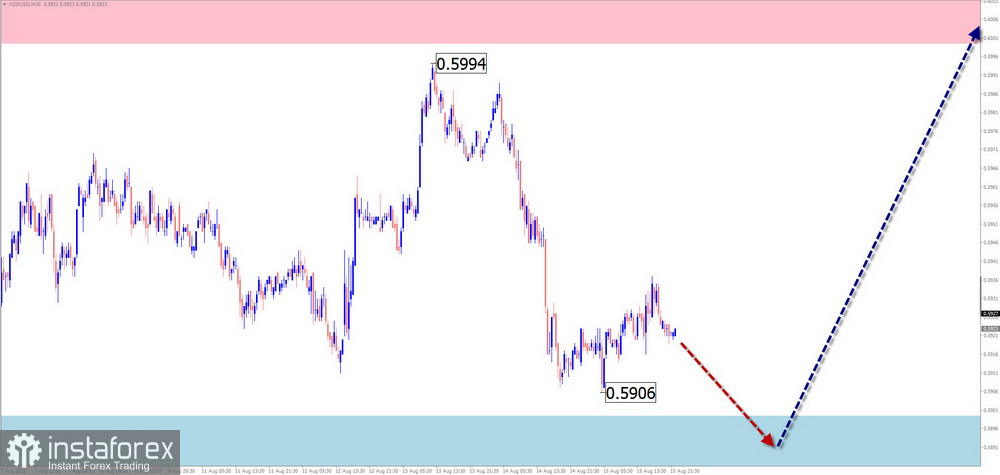
Analysis:On the NZD/USD chart, the main upward wave that started in early April remains dominant in the short term. The unfinished opposing section since early July is forming a correction. The structure of the wave shows it remains incomplete at the time of analysis.
Forecast:In the coming week, a generally sideways movement is expected. At the start of the week, temporary pressure on resistance is possible. Toward the end, a reversal and renewed decline may occur. Volatility is likely to be highest in the second half.
Potential Reversal ZonesResistance:
Support:
Recommendations:
- Purchases: Highly risky until the current decline ends, with little potential.
- Sales: Possible if entered at the end of corrective pullbacks. Potential is limited by support.
Gold
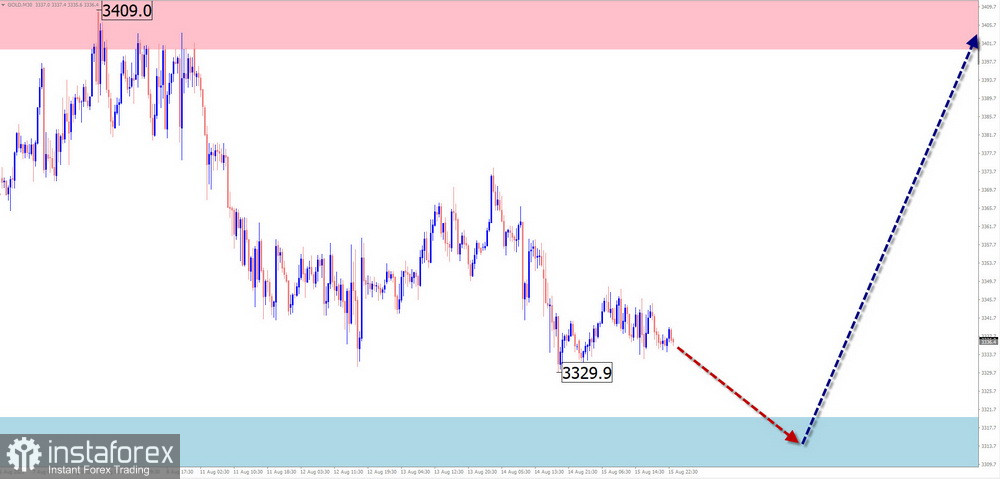
Analysis:Since April, the unfinished wave structure of gold has been moving sideways. The structure forms a "horizontal pennant" on the chart. At the time of analysis, the pattern remains incomplete.
Forecast:In the first half of the coming week, an upward bias is expected up to the resistance zone, with possible pressure on its upper boundary. A sideways pause and reversal are possible in this area. Renewed decline is more likely toward the end of the week.
Potential Reversal ZonesResistance:
Support:
Recommendations:
- Sales: May be used after confirmed reversal signals appear near resistance.
- Purchases: Low potential, risky.
#Bitcoin
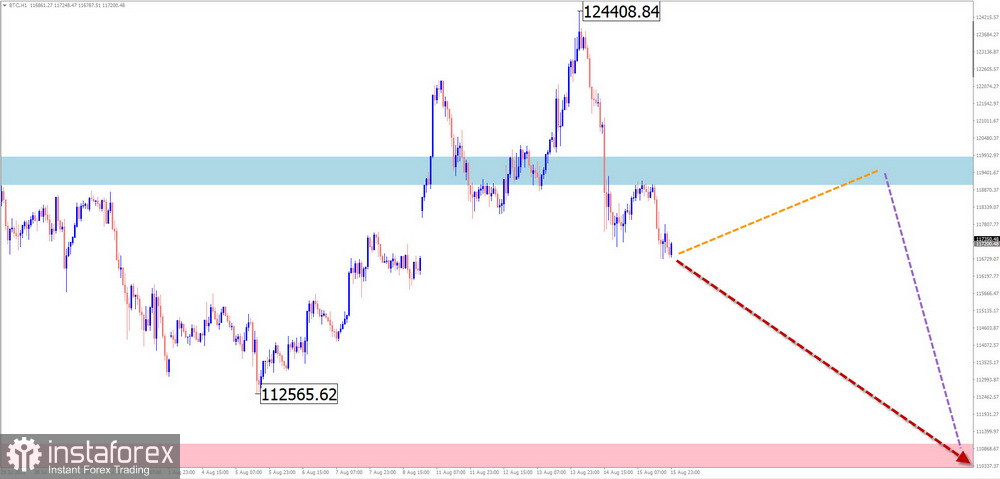
Analysis:Over the past month and a half, Bitcoin's price has been shaped by a downward segment, forming a flat corrective wave on the chart. Since August 14, the final part of the structure has been forming. Within it, price rebounded upward from strong support late last week.
Forecast:In the coming days, a generally sideways movement is expected. An upward pullback is likely up to the resistance zone, after which a sideways phase may follow, creating conditions for reversal. Renewed decline is possible at the end of the week or later.
Potential Reversal Zones Resistance:
Support:
Recommendations:
- Purchases: Limited upward potential should be taken into account. Such trades may be used in individual sessions with fractional volume sizes.
- Sales: Possible after confirmed signals appear near resistance on your trading systems.
Notes: In simplified wave analysis (SWA), all waves consist of three parts (A–B–C). On each timeframe, the analysis considers the last unfinished wave. Expected movements are shown with dotted lines.
Attention: The wave algorithm does not account for the duration of instrument movements in time.