GBP/USD 5-Minute Analysis
On Friday, the GBP/USD currency pair quite logically surged by more than 100 pips, as the labor market and unemployment reports once again proved to be disappointing. By the end of the day, the pair settled in the 1.3525–1.3548 area, which is a modified version of the 1.3509–1.3525 zone. A bounce from this area could trigger a new round of downward movement on technical grounds. However, in any case, we expect the dollar to keep falling in the medium term. It's important to understand that time is working against the US currency: the longer it takes, the more negative factors accumulate for the dollar. For example, just last week it became clear that the labor market is not sending any positive signals, while inflation and unemployment rates continue to climb.
Thus, in September, the Federal Reserve will resume monetary policy easing, and by year-end, it will likely cut the key rate at least twice. By next year, Donald Trump could have already replaced half of the FOMC, and from then on, rates will be cut as much as the president desires—his stated goal is at least a 3% cut. The dollar has no future at this point. The "dollar trend" lasted 17 years, so we are now very likely at the start of a whole new cycle of dollar depreciation.
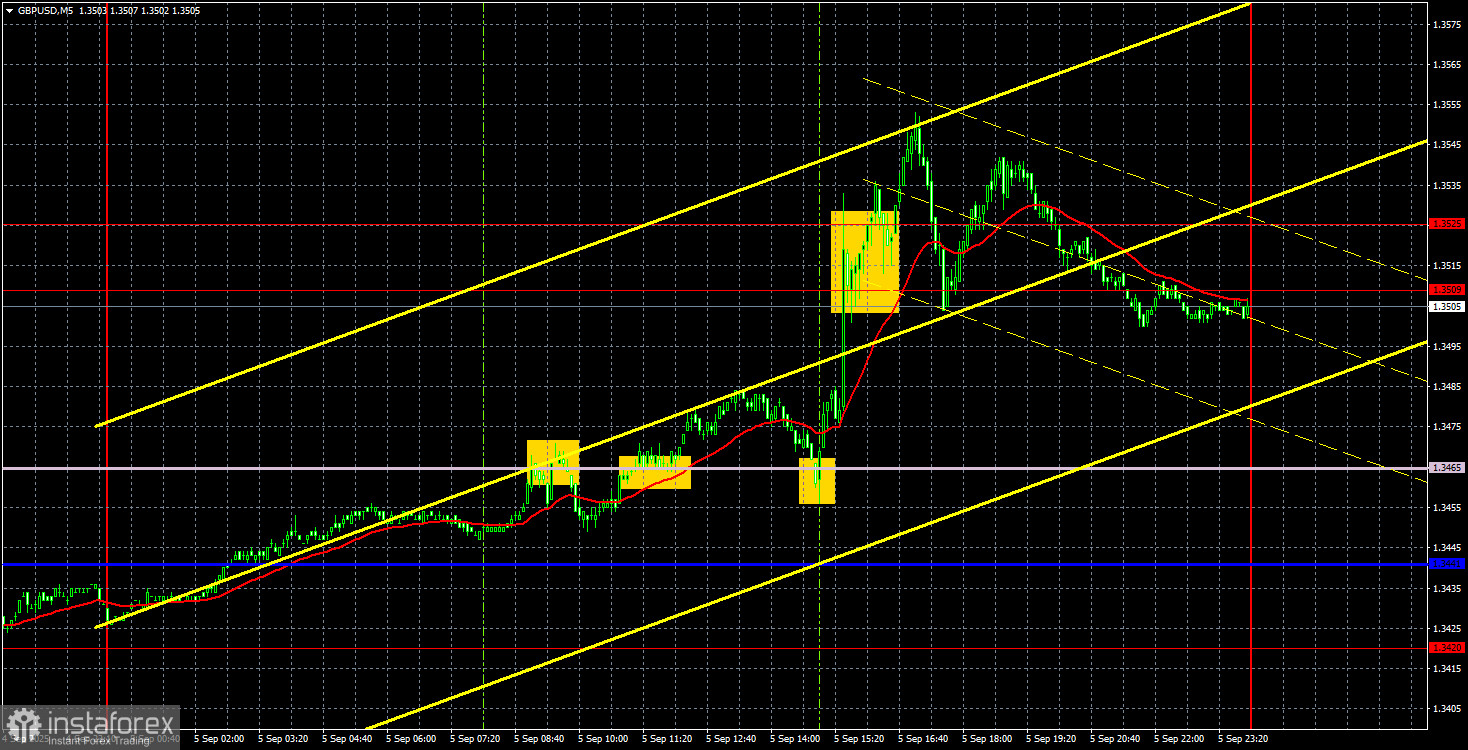
On the 5-minute chart for Friday, several trade signals were generated, but they were not as perfect as those for the euro. The price gave a false sell signal near the Senkou Span B line, then two duplicate buy signals near the same line. It was these last two signals that allowed traders to profit on Friday. Still, trade signals for the euro were much better; on the pound, trades could have hit breakeven.
COT Report
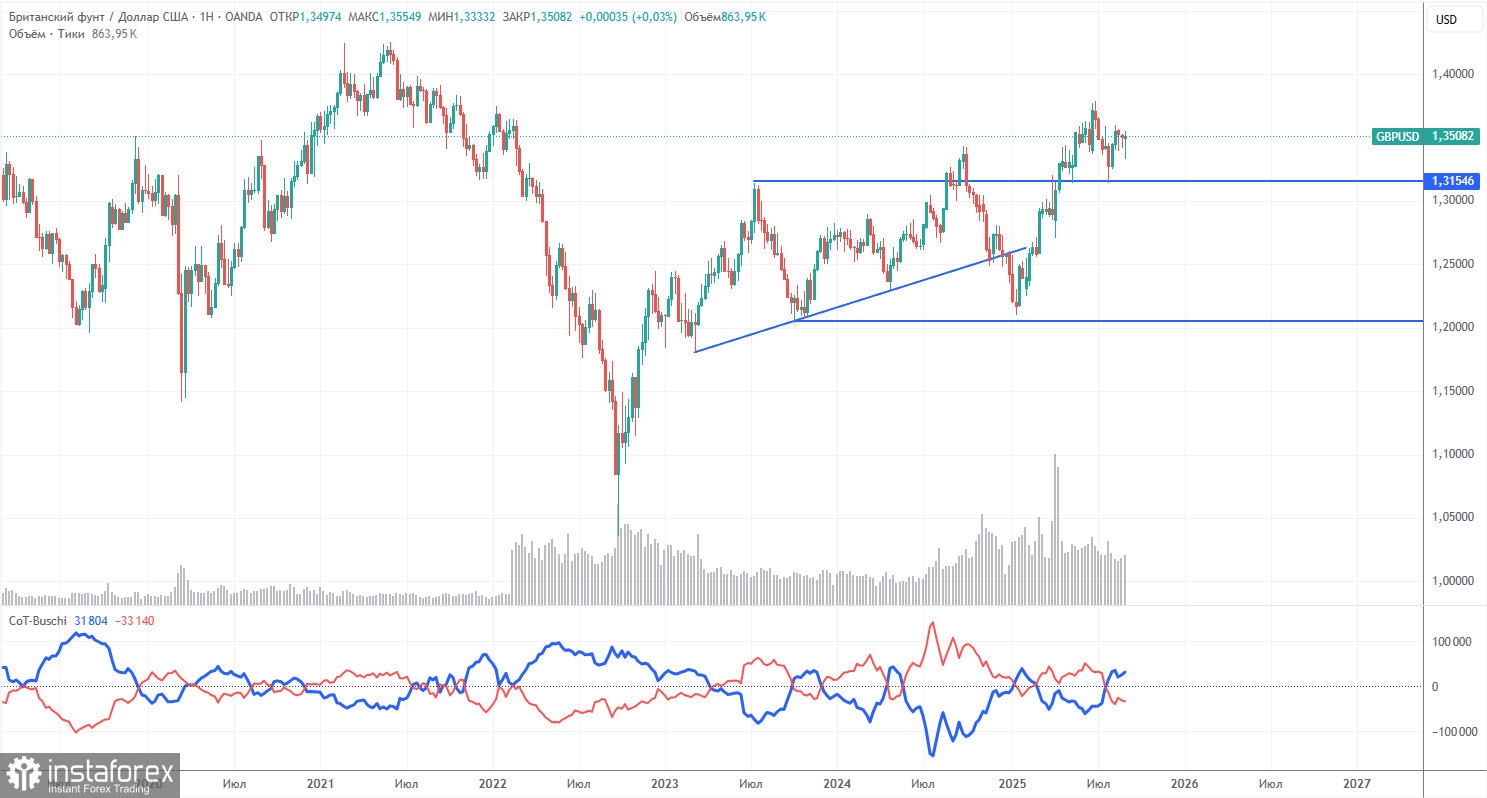
COT reports for the British pound show that in recent years, commercial traders' sentiment has constantly shifted. The red and blue lines—representing commercial and non-commercial net positions—constantly cross and, in most cases, are close to zero. Right now, they are at about the same level, which indicates roughly equal positions for buying and selling.
The dollar continues to decline due to Trump's policies, making demand from market makers for the pound sterling less significant at this time. The trade war will continue in some form for a long while. The Fed will cut rates anyway in the coming year. Dollar demand, one way or another, will fall. According to the latest pound sterling report, the "Non-commercial" group opened 600 BUY contracts and 1,800 SELL contracts. Thus, the net non-commercial position decreased by 1,800 contracts during the week.
GBP surged in 2025, but it's crucial to note that the primary factor was Trump's policy. As soon as that factor is neutralized, the dollar may rise again, but when is anyone's guess. No matter how fast or slow net positioning in the pound grows or falls, it's the dollar that keeps dropping—and usually at a faster rate.
GBP/USD 1-Hour Analysis
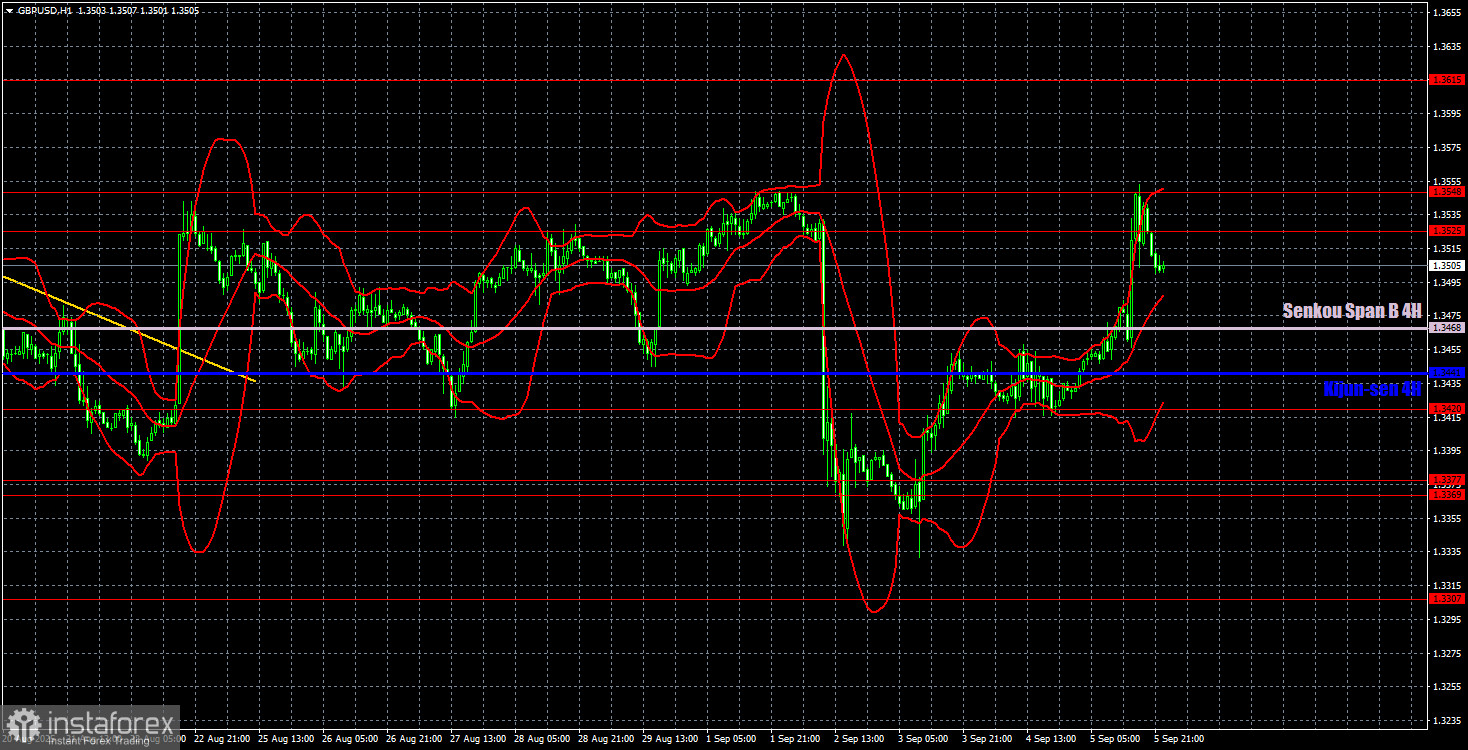
On the hourly chart, GBP/USD is ready to form a new uptrend. In our view, GBP/USD has corrected enough in recent weeks to resume the global uptrend that began back in January. The fundamental and macro background hasn't changed in recent weeks, so there's still no reason to expect a medium-term dollar rally.
For September 8, key levels to watch are: 1.3125, 1.3212, 1.3369–1.3377, 1.3420, 1.3525–1.3548, 1.3615, 1.3681, 1.3763, 1.3833, 1.3886. The Senkou Span B (1.3468) and Kijun-sen (1.3441) lines can also serve as signal sources. Set your Stop Loss to breakeven after a 20-pip favorable move. Ichimoku indicator lines can change during the day, so keep that in mind when trading.
On Monday, neither the US nor the UK has any important events or releases scheduled, so we'll likely see a "boring Monday."
Trading Recommendations
We believe that on Monday, a decline in GBP/USD could continue, since the price once again failed to break above the 1.3525–1.3548 area. Volatility may be low.
Illustration Explanations:
- Support and resistance price levels – thick red lines where movement may end. They are not trading signal sources.
- Kijun-sen and Senkou Span B lines—These are strong Ichimoku indicator lines transferred to the hourly timeframe from the 4-hour one.
- Extremum levels – thin red lines where the price has previously rebounded. These act as trading signal sources.
- Yellow lines – trend lines, trend channels, and other technical patterns.
- Indicator 1 on the COT charts – the size of the net position for each category of traders.